Wiki
- Designer Workshop - w/ Tutorials
Back to the War Of The Roses home page.
Back to Strategies - and Tips for First Time Players
If you have a 50/50 shot at taking the crown, should you go for it? ..or should you wait until you have a 60% or 70% chance of success? Of Course, it depends on a number of things. Are you ahead? ..behind? ..by how much? Are you gaining strength on the map - or losing strength?
Even if you know the answers to those questions, how do you know if you have a 50/50 shot in the fist place? This page won't attempt to answer the questions in the previous paragraph, but it should help you get a better handle on assessing the probabilities involved.
The following graph shows what 25%, 50%, and 75% kill rates look like for a given number of attacking mercenaries:
The error bars cover a range of 14, so assuming that most of the time you're attacking the crown with between 20 and 30 mercenaries, 7 looks like a reasonable number to use when estimating for a 25% higher or lower # kills.
This is a much more difficult part of the board to to evaluate. Likely you will have a 4-6 House Markers ranging from 3 to 10 nobles on them. Because small stacks end up attacking with less than 3 dice very quickly, their probabilities for success are inferior to those of the larger stacks.
This chart suggests that you would be lucky to take out 2 of the crown's guards half the time.
Houses with 6 nobles fair much better, killing 80% of their face value, or 5 of the King's guard or better most of the time.

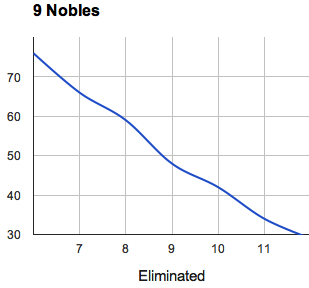
And once there are nine nobles attacking, they are almost bringing a 1 to 1 success ratio to the battlefield.
By looking at the above graphs, you can tweak the suggested counts below, but they should be good enough to give you a good idea of where you stand when considering whether or not to attack the crown.
The Mercenary graph is pretty easy to use, just plug in how many mercenaries you have and you can get a pretty good idea of what your range of success is. Or you can dispense with the graph and assuming you're attacking with between 20 and 30 Mercenaries..
With more than 30 mercenaries, you can add 1 more and subtract 1 less.
Markers are much more difficult to assess because the 3-spots skew so terribly south, and you are typically going to have at least a few of them. Probably the easiest thing to do is ignore the 3 and 4-spots, and calculate for cards with 2 vassals or more. These numbers might be a tad pollyannaish, but..
Finally, add in your last expected kills for your single vassal markers at the rate you're looking for..
Back to the War Of The Roses home page.
Back to Strategies - and Tips for First Time Players