-
Mon 28th Nov 2011 00:58 #1 / 7The probability of missing a 1/N event in N tries approaches 1/e as N gets large. I just wanted to put that in a signature.
In our discussions about luck, it sometimes comes up that luck stats measures how many armies you've lost (or not lost) compared to mediocre rolling. Useful though this is, it doesn't measure "how lucky or unlucky" a person's rolling has been. Good suggestions, definitely on the right track, were made in these threads:
http://www.wargear.net/forum/showthread/400/Luck_Stats
http://www.wargear.net/forum/showthread/1918/More_talk_about_luck
A quick summary is this: A luck stat of +20 with 100 rolls is pretty amazing, but a luck stat of +20 with 100000 rolls is not. In the above threads it's suggested that we calculate the standard deviation. To give something to the user that's easy to interpret, we can use the luck stat and the standard deviation to calculate a percentile.
A percentile is easy to understand: "Your rolling was as good or better than 87% of the possibilities" or (what everyone believes) "Your rolling was as good or better than 1% of the possibilities." In a column next to the luck stat, we'd just label it "Percentile" and then display the number. This is the end goal I hope we achieve.
Now, one thing we didn't do in the threads is actually give the correct details on how to do this that works regardless of the types of dice being rolled. I intend to do that in this thread. Brace yourselves for the nerdy posts that will follow.
-
Mon 28th Nov 2011 01:39 #2 / 7The probability of missing a 1/N event in N tries approaches 1/e as N gets large. I just wanted to put that in a signature.
Suppose the probability of an attacker losing 2 units is p; the probability of a split is q; and the probability of a defender losing 2 units is r.
Then the average number of units a defender loses per roll is q + 2r. The luck stats calculator has to know how to find p, q, and r for any type of dice.
Using those numbers, we can also calculate the variance. For now, never mind how I got this: It is q(1 - q) + 4pr, or alternatively, q(p + r) + 4pr.
The great thing is that with each roll, regardless of dice type, you can get the combined variance just by adding the per-roll variance to whatever the previous variance was. (You can do a similar thing with the mean - just add the per-roll mean to whatever the mean was to get an updated mean).
From there, you get the standard deviation by taking the square root. Armed with the mean, the standard deviation, and the user's rolling, we can calculate a percentile. The calculations for all of these things is barely more intensive (for a computer) than calculating a mean or a luckstat.
-
 Mon 28th Nov 2011 01:48 #3 / 7
The probability of missing a 1/N event in N tries approaches 1/e as N gets large. I just wanted to put that in a signature.
Mon 28th Nov 2011 01:48 #3 / 7
The probability of missing a 1/N event in N tries approaches 1/e as N gets large. I just wanted to put that in a signature.In full disclosure, I should add that the method I have in mind is using "normal distributions" from stats to approximate the "exact discrete distribution" given by the dice.
Unfortunately, keeping track of the discrete distribution of your rolls can involve considerable storage and computation. Suppose you've rolled 10,000 times in a game. Updating the discrete distribution will involve storing more than 10,000 numbers and then operating on them with each roll. I'd be surprised if the server could handle all of that for everyone. If it could, I'd say to use this.
But, assuming that's a bad idea, the way to go is approximating with normals. With more and more rolls, the approximations get better and better, and the calculations aren't much more for the computer than what we already do for luck stats.
-
Mon 28th Nov 2011 02:45 #4 / 7
The probability of missing a 1/N event in N tries approaches 1/e as N gets large. I just wanted to put that in a signature.
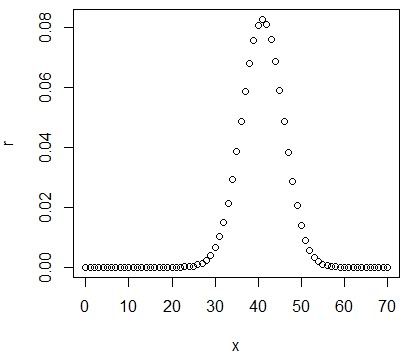
Here is a graph of the the discrete distribution for someone who rolled 20 6v6 rolls and 15 7v6 rolls (3 die versus 2). The x-axis is defenders lost, the y-axis the probability of that outcome:
Using the variance formula of the last post, I found that the mean for defender armies killed is 40.925 and the standard deviation is 4.8. Here is the normal distribution graphed on top of it:
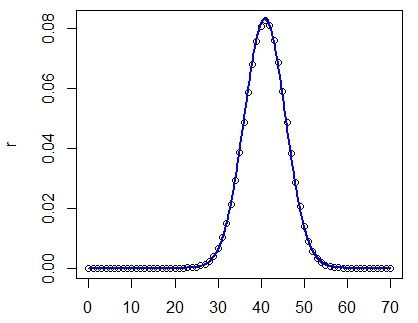
It's striking how they match. They were computed in very different ways. Nonetheless, the percentiles coming from the blue can be off by as much as 5%. The reason I think this is the way to go, is that if we compare it to some previous suggestions (using sqrt(n) as the sd), we can do much worse. The graph in red is the normal with an sd of sqrt(70):
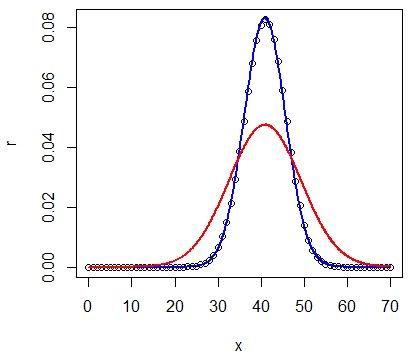
I expect that with larger numbers of rolls that the difference (for percentiles) between exact and the normal approximation will be negligible.
-
Mon 28th Nov 2011 06:43 #5 / 7
It should be possible to play WG boards in real-time ..without the wait, regardless of how many are playing.
Thank you Hugh!
This is all very encouraging. Clearly, the last graph shows that the simple sqrt method can be vastly improved upon ..but its heart was in the right place. A couple of quick thoughts and a question..
Though I would personally prefer a z-score , a percentile will probably make more sense for most people.
It sounds like the method you propose is iterative, which means that computing a score over a given range of games (like 100) may not be possible, but the amount of data produced over the course of one game doesn't sound like it would be too hard to deal when it comes to coming up with a score for a range withing the game (like from move 1000 to 2000). Is this possible?
https://sites.google.com/site/m57sengine/homeEdited Mon 28th Nov 06:46 [history]
-
Mon 28th Nov 2011 11:06 #6 / 7
The probability of missing a 1/N event in N tries approaches 1/e as N gets large. I just wanted to put that in a signature.
M, we'd have to calculate a z-score before a percentile, but I was thinking of what would be easiest to interpret. People who work with data a lot sometimes prefer z-scores.
I hadn't thought of using it over a range, so having the non-iterative makes sense too. The non-iterative method is to keep track of the different types of dice throws and use multiplication. In the example I gave of 20 6v6 and 15 7v6 throws, you multiply the per-roll variance of 6v6 by 20 and add it to the the per-roll variance of 7v6 times 15. Same with the mean.
So that too is computationally fast. For a large range of data, that should be the faster method. I chose iterative because I imagined luckstats as something that is itself updated and stored for quick lookup. If it's always calculated as the user presses the luckstat button, then updating is not the way to go. Either way, we have the technology :)
Edited Mon 28th Nov 11:14 [history]
-
Mon 28th Nov 2011 13:45 #7 / 7
It should be possible to play WG boards in real-time ..without the wait, regardless of how many are playing.
So it looks like we could have a running iteratively-derived score ..easy enough.
On the non-iterative front, I think it would be best if we could have two types of ranges to choose from.
- At the individual game level to include any range of moves.
- At the multiple game level to include any range of games.
#1 is do-able because the number of computations will be manageable, and#2 shouldn't be too bad if the totals from each game are ready and waiting, right?
For #2, Tom could limit the range to something like 500 or 1000 games depending on how much horsepower he's willing to spare.
https://sites.google.com/site/m57sengine/homeEdited Mon 28th Nov 13:51 [history]


